Cloud infrastructure helps us run apps and services but as systems grow bigger and more complex fixing problems by hand takes too long and can cause mistakes Self-healing cloud infrastructure solves this by automatically finding problems fixing them and keeping services running without humans.
This guide explains what self-healing cloud infrastructure is how it works real-life examples and why companies need it It also shows step-by-step how to build it what tools to use and how it keeps systems safe and reliable.
What is self healing cloud infrastructure
Self-healing cloud infrastructure is a smart system that watches cloud apps and platforms all the time. When it finds a problem it fixes it automatically or with very little help from humans. The goal is to keep services running all the time and fix problems quickly without waiting for people.
Key characteristics:
- Automated detection The system keeps checking metrics logs traces and tests to find anything unusual.
- Automated fixing When a problem is found it can restart services replace broken servers undo bad updates limit traffic or adjust routes automatically.
- Feedback loop The system checks if the fix worked If not it tries another fix or alerts a human.
- State reconciliation The system knows how it should be working and keeps making sure everything matches that desired state.
- Built for resilience Systems are designed with backups safe failures and the ability to handle unexpected problems.
Self-healing is more than just restarting a server It uses smart engineering monitoring rules and automation to keep services healthy at large scale
How Does Self-Healing Cloud Infrastructure Work?
Self-healing cloud infrastructure works like a smart control system. It watches the system, finds problems, decides the best action, fixes the issue and learns from it. It does this automatically so humans do not have to fix things manually.
The system constantly checks performance traffic usage errors and configurations It detects problems before they become serious Then it takes the best action like restarting a service replacing a server scaling resources or rerouting traffic It also measures the result to learn for next time The more it works the smarter it gets.
This way the system stays healthy and running even when problems happen, saving time, reducing mistakes and keeping users happy.
1. Observability Layer - Understanding the System’s Real-Time Health
This is the nervous system of the cloud.
It continuously collects signals that represent the health, performance, and behavior of applications and underlying infrastructure.

Key Signals Captured:
• Metrics
Quantitative measurements such as:
- CPU & memory usage
- Request latency (p50, p95, p99)
- Error rate (4xx/5xx)
- Queue depth
- Disk IOPS, network throughput
These metrics reveal performance degradation long before a failure occurs.
• Logs
Structured logs provide detailed insights into:
- Exceptions
- Stack traces
- Error messages
- Request-level events
- Security events
Patterns in logs often indicate deeper issues (e.g., memory leak, authentication failures).
• Distributed Traces
Traces help visualize the complete journey of a request across microservices.
They help detect:
- Bottlenecks
- Latency spikes
- Dependency failures
Essential in microservices environments.
• Synthetic Monitoring
Simulated user journeys perform actions such as:
- Logging in
- Checking out
- Searching products
This ensures the system works from a customer perspective.
• Configuration & Inventory State
Self-healing requires knowing:
- What services are deployed
- Which versions are running
- Which nodes/pods are active
- What the desired configuration state is
Collection Mechanisms
Signals are collected using:
- Prometheus exporters
- OpenTelemetry SDKs
- Fluentd / Fluent Bit
- Cloud vendor telemetry agents
- Service mesh sidecars (Envoy, Istio)
These signals are pushed to analysis backends where they become actionable.
2. Detection & Inference — Identifying That Something Is Wrong
Once data is collected, the system analyzes it to detect failure patterns or anomalies.
Technique 1: Rule-Based Detection
Simple but effective:
- “Error rate > 5% for 60 seconds”
- “CPU > 95% for 10 minutes”
- “Pod failing liveness probe”
These rules work for known, predictable issues.
Technique 2: Statistical / Anomaly Detection
More advanced models learn normal system behavior and detect deviations:
- Spike detection
- Trend analysis
- Moving averages
- Seasonality patterns
Useful when failures are gradual or irregular.
Technique 3: Machine Learning-Based Detection
ML models can identify complex, multi-signal failure patterns such as:
- Memory leaks
- Network saturation
- Abnormal process behavior
- Rare event signatures
Helps detect failures before they escalate.
Technique 4: Event Correlation
This links related symptoms across multiple layers:
For example:
- Latency spike
- Node OOM events
- Increased GC logs
→ Indicates a memory leak or resource pressure issue.
This reduces false positives and improves detection quality.
3. Decision & Remediation Policy — Choosing the Right Action
After detecting a problem, the system must decide what action to take.
Key Components of Decision-Making:
• Automated Runbooks / Playbooks
Codified instructions of what to do when a specific condition occurs:
- Restart service
- Redeploy pod
- Roll back deployment
- Scale out replicas
- Toggle feature flag
- Trigger database failover
These turn manual steps into automation.
• Priority & Escalation Rules
If Action A fails → try Action B → then Action C → then notify human on-call.
• Safety Checks
Before performing remediation, the system checks:
- Am I in a maintenance window?
- Is there an active deployment?
- Will this action increase risk?
- Is the component already healing itself?
Prevents over-corrections or harmful automated actions.
• Context-Aware Policies
Example: If a deployment is rolling out, temporarily suppress certain alerts.
Decision Engines
Implemented through tools such as:
- Argo Rollouts
- AWS Systems Manager Automation
- Rundeck
- Custom Kubernetes operators
- Crossplane controllers
- Event-driven workflows (Lambda, EventBridge)
These engines determine the most appropriate next step.
4. Execution & Orchestration - Performing the Healing Action
Once a decision is made, orchestration tools execute the action.
Types of Automated Actions:
• Service Control
- Restart container
- Kill/replace unhealthy pod
- Drain node
- Redeploy workload
Handled by:
- Kubernetes controllers
- Autoscaling groups (ASG)
- Docker runtime watchdogs
• Network Reconfiguration
- Update load balancer rules
- Shift traffic between canary and stable versions
- Trigger DNS failover
- Apply circuit breakers or retries
• Storage & Data Layer Actions
- Promote replica
- Re-sync a corrupted node
- Remount persistent volume
- Switch read-write endpoints
• Application-Level Fixes
- Disable problematic feature flag
- Revert dynamic config
- Refresh secret or token
- Restart business logic component
Important Principle: Idempotency
Actions must be safe to retry without unintended side effects.
Observability During Execution
Each action logs:
- What changed
- Why it changed
- Whether it succeeded
This ensures visibility and auditability.
5. Verification & Feedback — Confirming the System Has Recovered
After remediation, the system validates if recovery was successful.
Verification Includes:
- Running synthetic tests
- Checking liveness/readiness probes
- Re-inspecting metrics (latency, errors, CPU)
- Confirming service is reachable
- Verifying state integrity
If Recovery Succeeds
The system:
- Marks the incident as resolved
- Records all actions for audit
- Updates monitoring counters
If Recovery Fails
- Attempts alternative remediations
- Expands the scope (e.g., replace node instead of pod)
- Notifies human on-call with rich context
- Which signal triggered remediation
- Actions already tried
- Logs/traces of failure
- System state snapshots
This reduces diagnosis time for engineers.
6. Learning & Adaptation - Making the System Smarter Over Time
Self-healing isn’t static; it evolves with experience.
Learning Mechanisms:
• Incident Records
Every automated remediation is logged and later analyzed in postmortems.
• Improvement of Heuristics
Based on history, the system:
- Tunes thresholds
- Adds new detection rules
- Disables ineffective remediations
- Improves escalation paths
Machine Learning Optimization
ML models improve anomaly detection by learning from:
- Historical telemetry
- Success/failure patterns
- New failure modes
Chaos Engineering
Regularly inject failures using tools like:
- Chaos Monkey
- LitmusChaos
- Gremlin
- This helps validate if remediations work under real-world chaos conditions.
use cases for self healing cloud infrastructure
Self-healing is valuable across many cloud workloads. Here are concrete use cases and why they matter.
1. Production web services (SaaS)
- Problem: Sudden spike in 5xx errors due to a bad deployment.
- Self-healing: Canary deployment detects regression → automation rolls back, scales up healthy instances, and moves traffic. Customer impact minimized.
2. Stateful distributed databases
- Problem: Node disk failure or process crash in a distributed DB (Cassandra, MySQL cluster).
- Self-healing: Automated failover, promote replica, re-replicate data; orchestrated resync of nodes without manual DBA intervention.
3. Multi-region failover and DR
- Problem: Region outage.
- Self-healing: Health monitors detect cross-region latency and failure; DNS automation and routing policies shift traffic to a healthy region; stateful services switch to read replicas and later sync.
4. Edge and IoT fleets
- Problem: Thousands of devices with intermittent connectivity and software drift.
- Self-healing: Local watchdogs restart services, fallback to last known good configuration, report telemetry for remote orchestration.
5. CI/CD and deployment pipelines
- Problem: Broken builds or pipeline steps causing blocked deploys.
- Self-healing: Automated retries, cleanup of ephemeral resources, intelligent reroute of jobs, and rollback of partial changes.
6. Cost-Sensitive Autoscaling: Simple Version
Problem
If you have too many servers you waste money If you have too few users may face slow performance.
Self-Healing Solution
The system watches usage and predicts traffic It automatically adds more servers when needed and removes extra servers when not needed If scaling fails it fixes itself so everything runs smoothly and costs stay low.
7. Security and compliance posture
- Problem: Misconfigured security groups or open ports detected.
- Self-healing: Automated remediation tightens rules, reverts misconfigurations, and introduces compensating controls while triggering security reviews.
8. Platform reliability and developer productivity
- Problem: Developers waste time on repetitive ops tasks (restarts, rollbacks, certificate renewals).
- Self-healing: Removes repetitive toil from engineers, enabling focus on product work.
Each of these cases reduces MTTR, SLA breaches, and operational overhead. For regulated industries (finance, healthcare), automated checks with audit trails are especially useful.
why do you need self healing cloud infrastructure
The “why” is as practical as it is strategic.
1. Reduce Mean Time To Recovery (MTTR)
Automated detection and remediation drastically reduce MTTR. Faster recovery reduces user impact and business losses.
2. Scale operations without scaling headcount
As systems scale, manual operations become impossible. Self-healing lets engineering teams manage larger infrastructures reliably.
3. Improve reliability and customer trust
Automated recovery and graceful degradation contribute to higher availability and better user experience - both core to customer trust.
4. Remove human error and toil
Manual interventions cause configuration drift and mistakes. Automation enforces repeatable, tested remediations and prevents ad-hoc fixes.
5. Enable faster deployments
Confident rollout strategies (canaries, progressive delivery) combined with automated rollbacks allow teams to push changes faster without increasing risk.
6. Cost control and efficiency
Self-healing that includes intelligent autoscaling and remediation prevents unnecessary resource consumption while ensuring performance.
7. Meet regulatory and security needs
The system runs automatic checks to find mistakes in settings and fixes them fast It also creates proper audit reports that companies need for compliance
8. Future readiness
Technology keeps changing with serverless edge and multi cloud setups This makes systems more complex A self healing system can adjust on its own so it is ready for the future
Bottom line
Self healing infrastructure helps teams move from reacting to problems to preventing them before they happen
Key components of self healing cloud infrastructure
Building a self healing system needs many connected parts Here are the main ones
1. Observability and Telemetry
These tools help the system see what is happening
- Metrics like Prometheus CloudWatch Metrics Datadog
- Logs collected and stored in tools like ELK EFK or Splunk
- Tracing with tools like OpenTelemetry Jaeger Zipkin
- Synthetic monitoring with tools like Pingdom or Grafana Synthetic Monitoring
- Topology and inventory to know what services and resources exist
The most important thing is that all data must be clean stored for enough time and easy to search
2. Health & Check Instrumentation
- Probes: Liveness/readiness in Kubernetes, application health endpoints.
- SLOs/SLIs: Define what “healthy” means (latency, error rate, throughput).
- Alerting rules: Thresholds + multi-signal correlation to reduce noise.
3. Policy & Decision Engine
- Runbooks & playbooks: Codified remediation steps.
- Policy engine: Gate checks, risk scoring, escalation logic.
- Event processors: Systems like Cortex, Heimdall (generic term), that take events and choose actions.
4. Automation and Orchestration
This part handles how the system runs actions on its own
- Control plane
Tools like Kubernetes controllers operators and OPA policies help the system make smart decisions and keep everything in the right state. - Runbook executors
Tools like Rundeck AWS Systems Manager Automation and HashiCorp Waypoint run common tasks automatically so teams do not have to do them manually. - Infrastructure as Code
Tools like Terraform and Pulumi let teams define their setup in simple files The system then checks and fixes any drift to match the desired state. - CI CD
Tools like Argo CD Flux and Jenkins X help release updates slowly and safely so changes do not break the system.
5. Actuators — the effectors of change
- API access to cloud, container orchestrator, load balancer, DNS, and configuration services to execute remediation: restart pods, update LB, rotate credentials, revoke nodes, etc.
6. Safety & Governance
- Circuit breakers: Prevent high-risk automated actions.
- Approval gates: For critical remediations, human approval might be required.
- Audit trails: Immutable logs of automated actions for compliance.
7. Learning & Analytics
- Incident store: Structured incident data and postmortem repository.
- Machine learning models: Optional for anomaly detection or predictive scaling.
- Chaos engineering: Tools and practices to validate healers and discover hidden failure modes (Chaos Monkey, LitmusChaos).
8. Integration & Extensibility
- Event buses: Kafka, AWS EventBridge for event distribution.
- Service mesh telemetry: Istio/Linkerd for fine-grained traffic control and observability.
- Feature flagging: LaunchDarkly, Unleash for instant toggles.
These components interact to create a resilient feedback system: observe → decide → act → verify → learn.
How to build a self healing cloud infrastructure
Designing and implementing self-healing infrastructure is a program—not a single project. Follow a staged approach:
Stage 0 - Principles & foundation
Before coding automation:
- Define SLIs/SLOs/SLAs: What does “good” look like? Be explicit.
- Define ownership: Who owns each remediation policy?
- Create a safety policy: Limits on automated changes (max concurrent restarts, maintenance windows).
- Emphasize idempotency: All automated actions must be safe to run multiple times.
Stage 1 - Observability first
- Instrument applications and the platform for metrics, logs, and traces.
- Implement basic health checks (readiness and liveness).
- Establish a centralized telemetry pipeline and dashboards for key SLIs.
- Create synthetic tests that mimic user journeys.
Stage 2 - Declarative desired state & reconciliation
- Use IaC (Terraform, Pulumi) to define infrastructure.
- Adopt a controller that reconciles desired vs actual state (e.g., Kubernetes).
- Automate basic self-healing tasks: node replacement, pod restarts, auto-scaling.
Stage 3 - Codify playbooks & safe automation
- Translate runbooks into executable automation scripts that are:
- Idempotent
- Observable
- Rate-limited
- Integrate automation into a controlled executor (Rundeck, SSM, Argo Workflows).
Stage 4 - Intelligent detection and decision making
- Move from static thresholds to correlated detection and anomaly detection.
- Implement suppression rules to reduce alert noise and prevent cascading automation.
- Add rollback and progressive delivery logic for deployments (canaries, blue/green).
Stage 5 - Closed loop with verification
- Every automated action must trigger post-check verification.
- If verification fails, run secondary remediation or human escalation.
- Record telemetry of both action and verification for learning.
Stage 6 - Advanced: predictive and self-optimizing
- Implement predictive autoscaling using historical patterns.
- Add ML anomaly detection to search for subtle failure indicators.
- Use chaos engineering to validate remediations under controlled failure injection.
Stage 7 - Governance, security, and continuous improvement
- Audit logs for automated actions; rotate credentials and provide least privilege access to automation systems.
- Ensure vulnerability remediation (auto-patching for non-critical systems).
- Run regular postmortems and feed improvements back into playbooks and detection logic.
Practical implementation checklist (concrete steps)
- Inventory: Catalog services, owners, dependencies.
- Define SLIs for each customer-facing service.
- Instrument: Add metrics, traces, logs, and synthetic checks.
- Deploy monitoring stack (Prometheus/Grafana/OpenTelemetry/ELK).
- Automate safe remediations: restart policy, auto-scale, drain and replace nodes.
- Add progressive delivery: integrate Argo Rollouts/Flux for canary analysis and auto-rollback.
- Add safety controls: rate limits, maintenance windows, approval policies.
- Test: run chaos engineering experiments and simulate incidents.
- Iterate: after incidents, improve playbooks and detection rules.
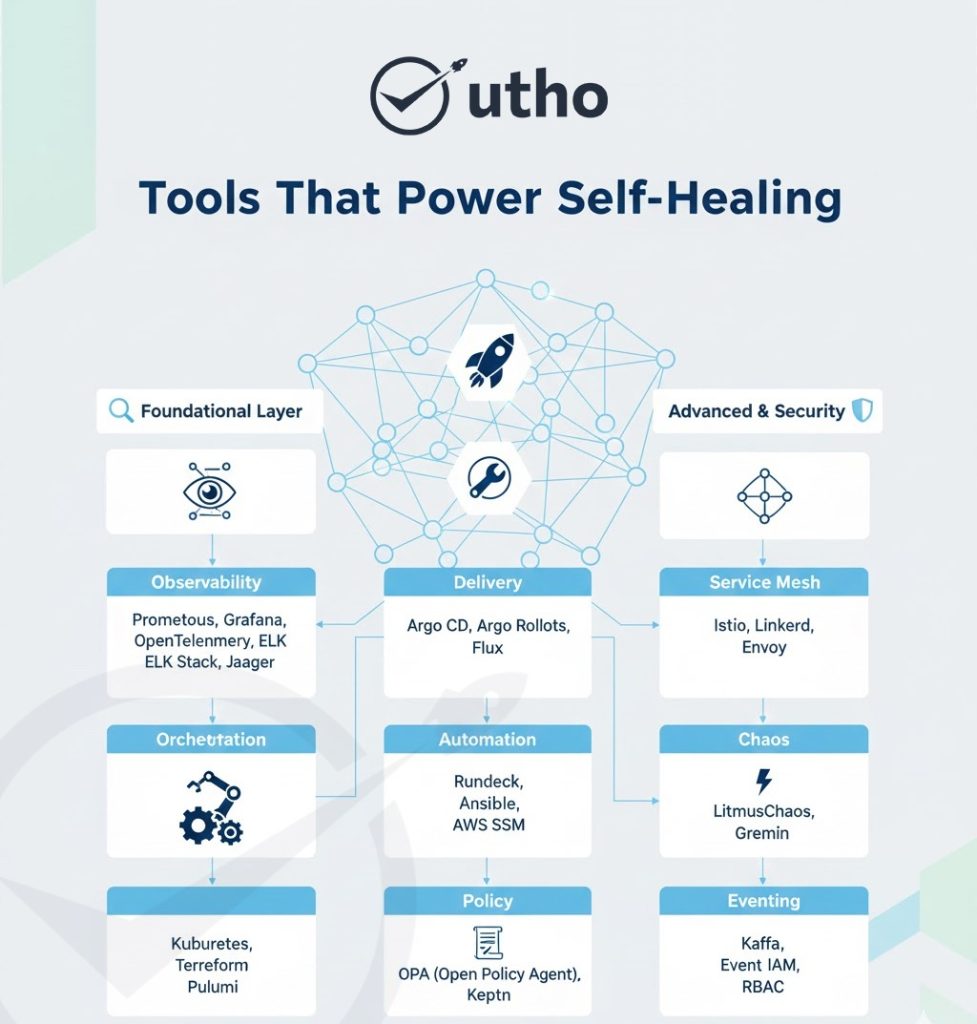
Tools and frameworks that enable self healing deployment
Below is a practical list of tools and frameworks commonly used to build self-healing systems. For many systems, a combination is used.
Observability & Telemetry
- Prometheus (metrics) — scrape exporters, alerting rules.
- Grafana — dashboards and alerting visualization.
- OpenTelemetry — unified telemetry (traces, metrics, logs).
- Jaeger / Zipkin — distributed tracing.
- ELK/EFK (Elasticsearch + Fluentd/Logstash + Kibana) — log aggregation.
- Datadog / New Relic / Splunk — commercial full stack observability.
Orchestration & Reconciliation
- Kubernetes — workload orchestration and controllers for reconciliation.
- Kustomize / Helm — templating and deployment manifests.
- Terraform / Pulumi — infrastructure as code for cloud resources.
Deployment & Progressive Delivery
- Argo CD — GitOps continuous delivery for Kubernetes.
- Argo Rollouts — progressive delivery (canary, blue/green) and automated rollbacks.
- Flux — GitOps operator for Kubernetes.
- Spinnaker — multi-cloud continuous delivery with advanced pipeline features.
Automation & Runbooks
- Rundeck — runbook automation and job orchestration.
- HashiCorp Nomad — alternative orchestrator with job scheduling.
- AWS Systems Manager Automation — cloud automation and runbooks for AWS.
- Ansible / SaltStack — configuration management and automated playbooks.
Policy & Decision Engines
- Open Policy Agent (OPA) — declarative policy enforcement.
- Keptn — event-based control plane for continuous delivery and operations.
- StackState / Moogsoft — event correlation and incident automation.
Service Mesh & Traffic Control
- Istio / Linkerd — traffic management, retries, circuit breaking, canaries.
- Envoy — sidecar proxy enabling traffic controls and observability
Chaos Engineering
- Chaos Monkey / Chaos Toolkit / LitmusChaos / Gremlin — simulate failures and validate healers.
ML & Anomaly Detection
- Grafana Machine Learning plugins or custom ML systems for anomaly detection.
- Open source ML libs: scikit-learn, TensorFlow for custom models.
Feature Flags & Config
- LaunchDarkly / Unleash — feature flagging for instant toggles and rollbacks.
- Consul / etcd / Vault — service discovery, config, and secrets management.
Eventing & Integration
- Kafka / NATS / RabbitMQ — event buses for asynchronous automation.
- AWS EventBridge / Google Pub/Sub — cloud-native eventing.
Security & Governance
- Vault for secrets management and automatic credential rotation.
- Cloud IAM & RBAC for least privilege access for automation actors.
Example workflow: Kubernetes + Argo Rollouts + Prometheus + Grafana + OPA
- Prometheus monitors SLIs and fires alerts when canary SLOs fail.
- Argo Rollouts automatically pauses a canary and then triggers a rollback on failure.
- OPA enforces policy preventing automated rollback during a major incident without approval.
- Grafana dashboards and alerts provide context to on-call engineers.
Design patterns & best practices
1. Declarative desired state
Use IaC and controllers to define desired state, enabling reconciliation when drift occurs.
2. Fail fast, degrade gracefully
Design services to fail in ways that maintain core functionality (e.g., read-only mode).
3. Circuit breakers and bulkheads
Prevent cascading failures by isolating components and limiting retries.
4. Idempotent remediation
Ensure remediation actions can run multiple times safely.
5. Progressive delivery + automated rollback
Combine canaries with automated rollback and observability for safe deployments.
6. Limit blast radius
Use namespaces, RBAC, resource quotas, and policy gates to reduce risk of automated actions.
7. Synthetic user checks
User journey tests are often more meaningful than raw system metrics.
8. Observability as code
Treat dashboards, alerts, and SLOs as versioned code.
9. Runbook automation first
Automate the easiest repetitive remediation tasks and expand gradually.
10. Test automations with chaos
Validate healers under controlled failures.
Pitfalls, challenges & how to mitigate them
False positives and noisy automation
- Risk: Automation repeatedly triggers on noisy signals, causing churn.
- Mitigation: Correlate signals, add hysteresis, use confirmation steps before heavy actions.
Dangerous automated actions
- Risk: Automation performs risky operations (e.g., mass deletion).
- Mitigation: Implement safety fences, approval gates, and simulation mode.
Configuration drift and complexity
- Risk: Ad-hoc manual changes break automation.
- Mitigation: Enforce GitOps and IaC, minimize direct console changes.
Security exposure
- Risk: Automation agents with broad permissions create attack surfaces.
- Mitigation: Principle of least privilege, audited service accounts, secrets rotation.
Over-reliance on automation
- Risk: Teams lose expertise and become blind to system internals.
- Mitigation: Balance automation with runbook knowledge, regular human reviews, and training.
Observability blind spots
- Risk: Missing signals make detection ineffective.
- Mitigation: Expand instrumentation, synthetic tests, and dependency mapping.
Measuring success: metrics & KPIs
Track these to evaluate your self-healing program:
- MTTR (Mean Time To Recovery) — main success metric.
- Number of incidents automatically resolved — automation coverage.
- False positive rate — automation noise level.
- SLO compliance — user-facing availability.
- Time to detect (TTD) — detection speed.
- Change failure rate — frequency of deployments causing incidents.
- Operational toil reduction — qualitative / time saved.
Real-world example (conceptual)
Imagine an e-commerce service using Kubernetes, Prometheus, Argo Rollouts, and a feature flag system:
- A new release is pushed via Argo Rollouts as a 10% canary.
- Prometheus watches the canary’s 95th percentile latency and error rate against the baseline SLO.
- Canary crosses error threshold → Prometheus alert triggers an event to the control plane.
- The decision engine (Argo Rollouts + policy layer) pauses rollout and triggers an automated rollback because policy allows auto-rollback for critical SLO breaches.
- Rollback completes; post-rollback synthetic checks validate user journeys.
- Incident closes automatically if checks pass; otherwise, escalation happens with full context (artifacts, logs, traces) delivered to on-call.
- Postmortem recorded; runbook updated to include additional telemetry.
This flow minimises customer impact and frees engineers from manual rollback work.
Future directions
- Adaptive control systems: More closed-loop AI that tunes thresholds and remediations automatically.
- Cross-platform orchestration: Unified healing across multi-cloud and hybrid environments.
- Finer-grained policy enforcement: Contextual policies that combine business intent and runtime state.
- Secure automation: Automated mTLS, zero-trust automation gateways, and safer credentials handling.
- Autonomous SLO driving: Systems that automatically adjust resources to meet SLOs economically.
Conclusion
Self-healing cloud infrastructure is not a silver bullet—but it is the pragmatic next step for teams that want to run complex systems reliably at scale. By investing in observability, codified remediation, safety controls, and continuous testing, organizations can reduce MTTR, eliminate repetitive toil, and deliver better user experiences.
Start small: automate the easiest and highest-value runbooks first; instrument thoroughly; iterate with safety in mind. Over time, you'll transition from reactive operations to a proactive, resilient platform that adapts and heals itself—and that’s where the future of cloud operations is headed.


