Kubernetes has changed how we deploy, scale, and manage containerized apps. It provides the orchestration needed to run complex workloads efficiently. However, as your Kubernetes environment grows, keeping a pulse on your clusters becomes a critical necessity. Real-time insight into your clusters is key. It ensures smooth operations, finds performance bottlenecks, and keeps apps running well. That's where Kubernetes monitoring tools come into play.
In 2026, monitoring Kubernetes means more than tracking metrics. It's about gaining deep visibility into your containerized apps. You must proactively identify issues and secure your cloud-native infrastructure. With many monitoring solutions, choosing the right tool is crucial. Developers, operations teams, and DevOps engineers need it to manage Kubernetes workloads.
Why You Need Kubernetes Monitoring Tools
Kubernetes simplifies the deployment and scaling of applications, but it comes with its own set of complexities. Monitoring tools help with these complexities. They provide a detailed view of your Kubernetes ecosystem. Here’s why having robust Kubernetes monitoring tools is vital:
- Visibility & Observability: Kubernetes operates at many layers—nodes, pods, containers, and services. A proper monitoring tool provides visibility into each layer. It gives insights into application health, cluster status, and resource usage.
- Performance Optimization: Monitoring tools track CPU, memory, network, and storage usage. They help you optimize resources and find performance bottlenecks before they affect your apps.
- Proactive Alerting & Incident Management: To maintain uptime and reliability, alert mechanisms are essential. Monitoring tools provide timely alerts to catch issues early and resolve them quickly.
- Security & Compliance: Monitoring isn't just about performance. It also means securing your workloads. Monitoring tools provide security insights, detect anomalies, and track compliance. They protect your data and ensure safe operations.
Key Factors to Consider When Choosing Kubernetes Monitoring Tools
With many options on the market, it’s important to pick the right Kubernetes monitoring tool for your specific needs. Here are some factors to consider:
- Real-Time Monitoring & Dashboards: Use tools with real-time data and customizable dashboards. They should visualize your clusters' health and performance.
- Unlimited scalability demands a monitoring solution that can effortlessly process massive metrics and logs at incredible speeds, ensuring your Kubernetes workloads grow without constraints.
- Alerts & Automation: Use tools that let you customize alerts for breached thresholds, anomalies, or unexpected behaviors. They should also be able to fix issues automatically.
- Choose tools that integrate with your existing stack. This includes your CI/CD pipelines, logging tools, and security solutions. It will ensure a unified monitoring experience.
- Ease of Setup & Use: A monitoring tool's usability depends on its UI, setup, and docs. This is key for teams new to Kubernetes.
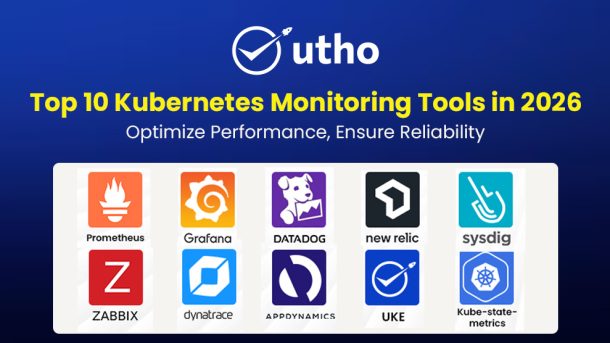
Exploring the Top 10 Kubernetes Monitoring Tools
Kubernetes environments change constantly. You need the right monitoring tools to maintain control. This blog ranks the top 10 Kubernetes monitoring tools for 2026. It details how they help you track performance, issue alerts, visualize data, and secure clusters. From open-source solutions like Prometheus to all-in-one platforms like Datadog, and to cost-effective options like Utho, there's a perfect fit for every situation. Choose the ideal tool for your Kubernetes setup and ensure your apps run securely and efficiently.
1. Prometheus – The Industry Standard for Monitoring and Alerting
Kubernetes monitoring needs a top-tier solution. Prometheus delivers. It has a powerful, open-source design and great flexibility. Built for cloud-native environments, it expertly handles complex metrics collection and alerting.
Key Features:
- Powerful Query Language (PromQL): Allows real-time querying for deep insights.
- Multi-dimensional Data Model: Efficiently stores and retrieves metrics in a time-series format.
- Alerting Capabilities: Integrates well with alert managers and supports custom alert rules.
Best For: Organizations seeking scalable, customizable monitoring for their Kubernetes clusters.
Benefits:
- Open-source and widely supported by the community.
- Customizable; works seamlessly with Grafana for visualization.
- Highly flexible with no licensing costs.
2. Grafana – The Visualization Layer for Metrics
Grafana harnesses its powerful visualization capabilities to transform Prometheus data into actionable insights. Interactive dashboards let users quickly interpret and respond to key Kubernetes metrics.
Key Features:
- Customizable Dashboards: Create detailed visualizations for any data source.
- Alerts & Notifications: Customizable alerting system integrated with email, Slack, and other channels.
- Wide Data Source Integration: Connects with Prometheus, Elasticsearch, Graphite, and more.
Best For: Teams needing custom dashboards to visualize data from multiple sources in real-time.
Benefits:
- Open-source and highly customizable.
- Flexible integration with a wide range of data sources.
- Scalable for both small and large Kubernetes environments.
3. Datadog – All-in-One Monitoring for Cloud & Containers
Datadog provides a platform for monitoring, security, and analytics. It offers Kubernetes monitoring that automatically discovers and tracks clusters and workloads.
Key Features:
- Auto Discovery of Services: Detects Kubernetes components and workloads automatically.
- Unified Metrics, Logs, and Traces: It allows real-time monitoring and full visibility into Kubernetes environments.
- Alerts & Anomaly Detection: Uses machine learning for anomaly detection and customizable alerting.
Best For: Organizations looking for a unified monitoring solution with deep insights into container performance and cloud environments.Benefits:
- Easy integration with Kubernetes.
- Real-time monitoring backed by machine learning for anomaly detection.
- Pre-built dashboards for quick insights.
4. New Relic – Comprehensive Kubernetes Monitoring & Observability
New Relic provides a full-stack observability platform, delivering insights across applications, infrastructure, and Kubernetes clusters. It provides extensive visualization and monitoring capabilities for detailed real-time insights.
Key Features:
- Unified Observability: Centralized data collection from applications, clusters, and infrastructure.
- Kubernetes Cluster Explorer: Intuitive visual representation of clusters, nodes, and workloads.
- Anomaly Detection with Alerts: AI-based alerts for performance and security anomalies.
Best For: Enterprises seeking comprehensive observability across their Kubernetes clusters and application stack.
Benefits:
- AI-driven anomaly detection for proactive monitoring.
- Real-time cluster visualization for deeper insights.
- Integrates with various data sources for a unified overview.
5. Sysdig – Security & Monitoring in One Tool
Sysdig offers a unique combination of performance monitoring and security for Kubernetes environments. The tool provides deep visibility into containerized applications while also ensuring security compliance.
Key Features:
- Container Security & Performance Monitoring: Monitors the health and performance of workloads and detects security threats.
- Full-Stack Visibility: End-to-end monitoring from applications to infrastructure.
- Real-Time Metrics & Logs: Provides insights into CPU, memory, network traffic, and other key metrics.
Best For: Businesses that need both performance monitoring and security insights for their Kubernetes clusters.
Benefits:
- Security-focused monitoring to ensure compliance.
- Real-time threat detection for enhanced security.
- Full-stack observability for in-depth container performance.
6. Zabbix – Open Source Monitoring Solution for Kubernetes
Zabbix is a popular open-source monitoring tool that provides a scalable and customizable way to monitor Kubernetes clusters. It supports real-time monitoring of resources, containers, and workloads.
Key Features:
- Auto-Discovery & Monitoring: Automatically detects new nodes and containers.
- Custom Templates & Alerts: Allows the creation of custom templates and alerting rules.
- Highly Scalable: Can monitor Kubernetes environments of all sizes, from small setups to enterprise-scale clusters.
Best For: Teams looking for an open-source and highly customizable Kubernetes monitoring tool.
Benefits:
- Free and open-source, with no licensing costs.
- Customizable to fit different data sources and metrics.
- Scalable solution for large and complex Kubernetes environments.
7. Kube-state-metrics – Native Kubernetes Metrics Collection
Kube-state-metrics is a native Kubernetes monitoring tool that collects detailed metrics from the Kubernetes API server. It provides in-depth data on the state of clusters, nodes, pods, and more.
Key Features:
- API Server Data Collection: Provides metrics on all Kubernetes resources like nodes, pods, and namespaces.
- Real-Time State Monitoring: Monitors the health and state of Kubernetes clusters and workloads.
- Resource Metrics: Offers insights into resource consumption and helps identify issues.
Best For: Developers and DevOps teams needing Kubernetes-native metrics to track the health and state of their clusters.
Benefits:
- Simple and easy to set up.
- Native to Kubernetes, providing direct API server metrics.
- Highly detailed and accurate metrics for cluster performance.
8. Dynatrace – AI-Powered Full-Stack Monitoring
Dynatrace provides advanced AI-powered monitoring and observability for applications, infrastructure, and Kubernetes clusters. With its automatic root cause analysis, Dynatrace helps you understand dependencies and detect anomalies in containerized environments.
Key Features:
- Automatic Dependency Mapping: Automatically tracks relationships between services, applications, and clusters.
- AI-Powered Insights: Uses AI for predictive analytics and real-time anomaly detection.
- End-to-End Observability: Provides a full view of your Kubernetes workloads, applications, and infrastructure.
Best For: Organizations seeking AI-driven insights for full-stack monitoring across their Kubernetes environment and tech stack.
Benefits:
- Predictive analytics for proactive issue detection.
- Automated setup for quick monitoring of Kubernetes clusters.
- Custom dashboards for real-time insights.
9. AppDynamics – Kubernetes Monitoring for Application Performance
AppDynamics, a Cisco-owned platform, focuses on application performance monitoring for Kubernetes clusters. It offers comprehensive insights into applications running on Kubernetes and helps identify performance bottlenecks.
Key Features:
- Kubernetes Application Performance Monitoring: Monitors application health and performance within Kubernetes clusters.
- Unified Cluster View: Offers insights into the health and performance of nodes, workloads, and applications.
- Business Correlation: Links application performance within Kubernetes to business outcomes and KPIs.
Best For: Businesses looking for detailed insights into application performance and its impact on business operations within a Kubernetes environment.
Benefits:
- Business-level metrics for Kubernetes performance.
- Extensive alerts to track application and cluster health.
- Insightful correlation between Kubernetes and business performance.
10. Utho’s Managed Kubernetes Hosting
While Utho is not a monitoring tool, it simplifies Kubernetes deployment and management. Get automated Kubernetes deployment up and running in minutes with Utho's managed Kubernetes hosting. This efficient solution lets you easily manage and scale containerized applications. Utho guarantees 99.99% uptime, ensuring seamless operations so you can focus on what matters most – your business.
Key Features:
- Automated Kubernetes Deployment: Deploy Kubernetes clusters quickly and easily.
- High Uptime SLA: A 99.99% uptime guarantee ensures reliability and availability.
- Simplify Kubernetes setup and deployment with our streamlined process, allowing you to scale faster and ensure high availability.
- Best For: Businesses aiming for fast Kubernetes deployment, high scalability, and reduced operational complexities.
Benefits:
- Faster deployment and reduced downtime.
- Scalable infrastructure that grows with your business needs.
- Focus on core operations without manual setup delays.
Choosing the Right Kubernetes Monitoring Tool
Optimize your Kubernetes environment with the right monitoring tool. Without it, you risk poor performance, security threats, and wasted resources. Choose from a range of options, such as Prometheus and Grafana for open-source power, Datadog and New Relic for all-in-one solutions, or Sysdig for security-focused insights. Consider your specific needs: do you prioritize cost-efficiency, scalability, security, or easy integration? Select the best tool for your requirements and unlock peak cluster performance.